Skip to content

Erin M. Holliday

  • Home
  • About
  • Resume
  • Work
    • Online Newswriting
    • Copywriting
      • Print
      • Digital
    • Infographics
    • Storytelling
  • Contact

Irth Solutions Infographic, Fig. 3-2

May 22, 2013April 7, 2019 | eleemccarthy

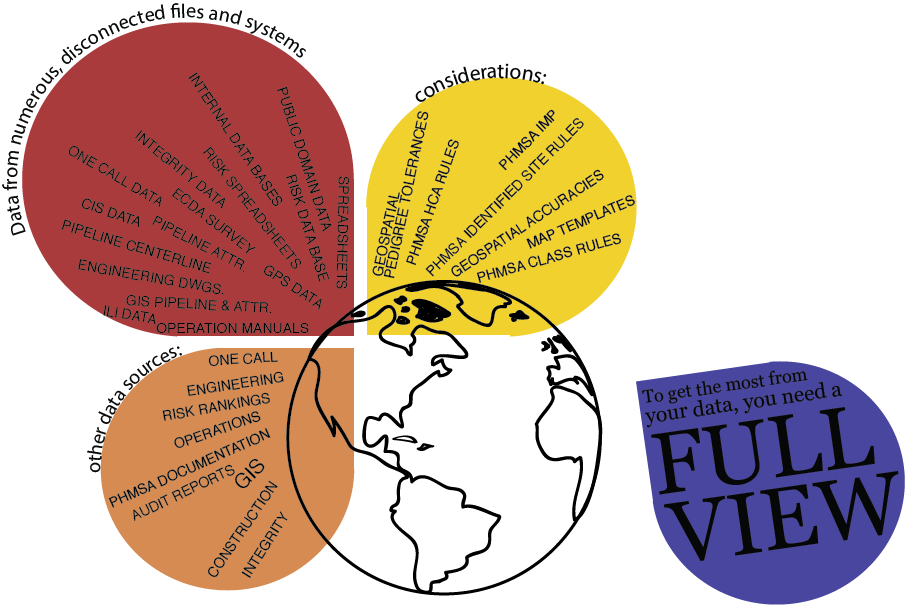
This graphic was in this white paper.

The image shows the numerous locations that are sources for pipeline data and how they all need to come together into one place to get the most accurate data analysis.

fullview

Share this:

  • Click to share on X (Opens in new window) X
  • Click to share on Facebook (Opens in new window) Facebook
Like Loading...

Related

Posted in Infographics

Post navigation

< Newsletters
Bike Source News: >
Website Powered by WordPress.com.
  • Reblog
  • Subscribe Subscribed
    • Erin M. Holliday
    • Already have a WordPress.com account? Log in now.
    • Erin M. Holliday
    • Subscribe Subscribed
    • Sign up
    • Log in
    • Copy shortlink
    • Report this content
    • View post in Reader
    • Manage subscriptions
    • Collapse this bar
 

Loading Comments...
 

    %d