Created for the Pennsylvania Interbranch Commission for Gender, Racial, and Ethnic Fairness.
Infographics
Opportunity Infographic for the Jack Kent Cooke Foundation
Learn more about my excellencegap.org project.
Closing The Excellence Gap with the Jack Kent Cooke Foundation
One project in particular for the Jack Kent Cooke Foundation that I worked on in partnership with our lead strategist led me to research the gap that exists in opportunity for low-income, high achieving learners. From this, we created excellencegap.org, which translated heavy jargon-loaded research into sizeable, organized, and digestible pieces. The site contains an “ages and stages” portal that describes why this gap is so important, why it happens, and what can be done about it. My role was to aid in this research and content development, as well as provide final copy and grammar edits.
Here are a few screengrabs from the Early Grades segment:
Ages and Stages:
See all the research compiled and presented at excellencegap.org.
We also worked with their video team to develop this project:
U.S. Hospitality Industry Statistics
How do you become a chiropractor?
Originally published: http://chiropractic-career-blog.nycc.edu/2016/10/27/become-a-chiropractor/
What’s in a tidy tack room? – Infographic
Originally published: http://equestrian-studies-blog.williamwoods.edu/2015/02/tips-to-a-tidy-tack-room/
Jack Kent Cooke Foundation – Infographic
Irth Solutions Infographic, Fig. 3-2
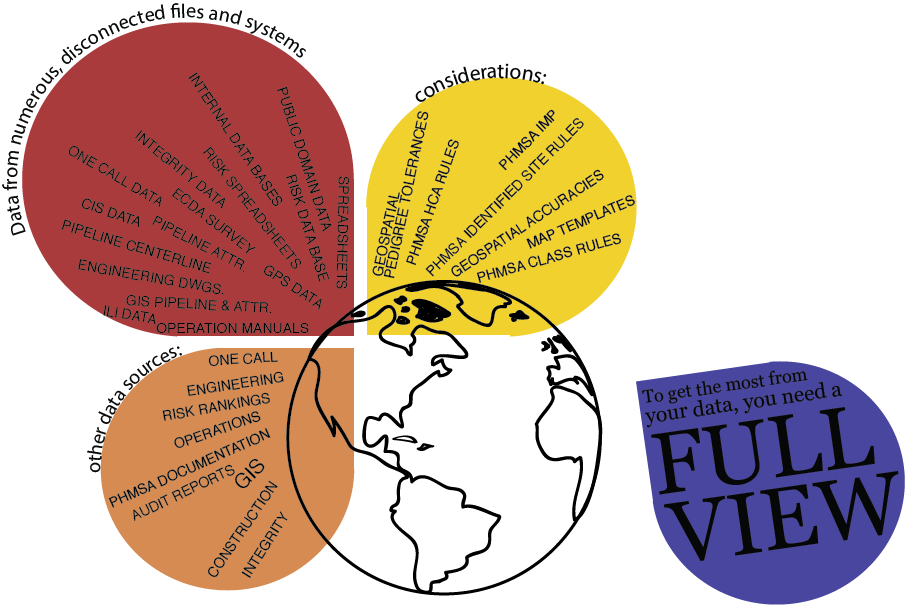
This graphic was in this white paper.
The image shows the numerous locations that are sources for pipeline data and how they all need to come together into one place to get the most accurate data analysis.